

The tweezers candlestick pattern is usually formed by two candlesticks with the same maximum or minimum price values. Visually, this pattern resembles the spread legs of tweezers, which is where the name of this pattern comes from. In a rising market, the top of the ‘tweezers’ is usually formed by two candles that have the same maximum values. In a falling market, a tweezer base is obtained where two nearby candles have identical lows. Tweezer bases and tops can be formed by the bodies of candles, their shadows or two ‘doji’ candles.
Significance of the ‘tweezer’ model
These patterns can be formed during neighbouring trading sessions or even during one trading session, at consecutive local lows or highs. Therefore, a tweezer pattern cannot be a strong reversal signal. The significance of a tweezer top or base increases if they are formed after a long uptrend or downtrend and their reversal character is confirmed by other indicator or candlestick signals.
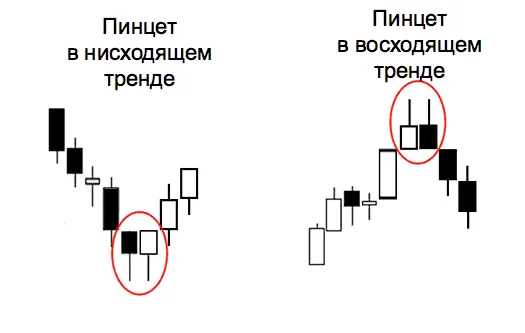
Varieties of the ‘tweezers’ model
A pincer vertex and a harami cross
This pattern, where the maximum prices are the same, can be a strong market reversal signal. After a strong bullish candle, a small ‘doji’ candle is formed with a downward price gap, but the maximum coincides with the maximum value of the previous, white candle. This combination is a ‘harami cross’ pattern and a ‘tweezer’ top at the same time, which increases its importance as a price movement reversal pattern.
The pinnacle of ‘tweezers’ and ‘hanged man’
This pattern is formed by two, usually contrasting candles. First, a strong white candle is formed, then, after the next candle opens, the price begins to fall, but the bulls try to regain lost positions and push the price up, although they do not have enough strength to reach the opening price. As a result, a candle is formed, which has a long lower shadow and a tiny body at the very top of the candle. If the next candle opens below the body of the ‘hanged’ candle, it can be considered with great confidence that the market has reached its top and there will be a downward price movement.
A pincer top and a shooting star
This combination is also formed by a strong bullish candle with a long body, after which, with a large price gap downwards, the next candle opens. After the opening the growth starts, but when the previous high is reached, the price starts moving downwards and closes not far from the opening price. The result is a candle that has a long upper shadow, as evidence of a failed attempt by the bulls to regain their positions, and a small body at the bottom of the candle. Usually, a ‘shooting star’ candlestick has no lower shadow at all or it is very short. The next candle that opens below the body of the ‘shooting star’ reinforces the importance of this type of top ‘tweezers’ as a signal of a trend change.
A pincer peak and a ‘veil of dark clouds’
Usually, after a long upward movement, a bullish candle with a long body is formed, and the subsequent candle opens with some upward price gap, but after opening and reaching the previous price high, the price starts to move downwards. The candle closes by overlapping most of the body of the previous, bullish candle, forming a ‘dark cloud veil’ pattern. Taking into account that the highs of these candles are the same, we get a ‘tweezer’ top and at the same time, a bearish reversal signal – the candlestick pattern ‘dark cloud veil’.
Base ‘tweezers’ and ‘hammer’
As a rule, after a long downward price movement, a bearish candle with a strong body is formed. The next candle, after opening with an upward price gap, reaches the minimum of the previous candle, after which the price starts to rise. This candle closes not far away, just above the opening price. This candlestick combination may indicate that the bears have lost control over the market and the current price trend may change to the opposite one. This candlestick combination can be considered as a kind of ‘harami’ pattern.
Tweezer base and cloud gap
The pattern is usually formed after a long downtrend. At first, a strong bearish candle with a long body is formed, and the next candle opens after a downward price break. After reaching the minimum of the previous candle, the price starts to rise and the candle closes, covering most of the body of the previous candle. This model, unlike the usual ‘gap in the clouds’ model, has the opening of the second candle below the closing price of the previous candle, not below the previous minimum, but at the same time the minimum price values are the same.