

Candlestick reversal patterns, it would be more accurate to call them not reversal patterns, but patterns that warn of an imminent change of trend. Most reversal patterns only warn about a possible change of direction, but this does not mean that after the formation of a reversal candlestick combination, the price will immediately turn in the opposite direction. It is quite likely that when a reversal pattern occurs in a bull market, the price will not immediately turn downwards, but will start a sideways movement in flat. One of the strong signals of reversal at the top are reversal candlestick patterns ‘Hanging Man’ and ‘Hammer’.
Where the ‘hung’ and ‘hammer’ patterns arise
These candles are formed usually with a small body at the top of the price range, which form a long lower shadow, usually much longer than the body. What is noteworthy is that both of these candles can be bearish or bullish. In Japanese, the hammer candle, which usually occurs after a long downtrend, sounds like ‘takuri’, which translates as: ‘an attempt to measure depth by probing the bottom with the foot’. Hanging pattern, which occurs after a long bullish move.
What the models look like
Hanging and hammer reversal patterns can always be identified by three obvious signs.
- The body of the candle is small, always in the upper third of the price range. Moreover, the body of the candle can have any colour.
- The candle has no upper shadow at all, or it is very short.
- The lower shadow is usually much longer than the body – twice or more.
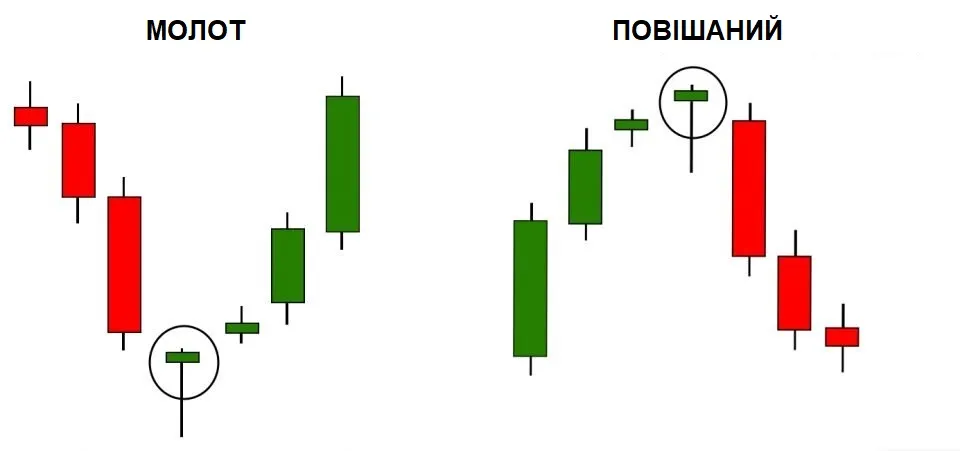
Reinforcing features of the models
The shorter the candlestick body and upper shadow, and the longer the lower shadow, the much stronger the potential of the ‘hammer’ or ‘hanged man’ patterns. Stronger signs of a quick reversal are observed if the Hammer has a white body, and the Hanged Man has a black body colour. If the ‘hammer’ model has a white body, it means that during the whole time interval the price was falling, then there was a revival, the price began to rise and by the end of the time interval equalled the opening price of the candle and even became higher than it, which emphasises the bullish mood of the market. If the hanging man has a black body, it means that the bulls have no strength to push the price to the candle opening level and that the market is in a bearish mood.
Signal acknowledgement
After the formation of one of the reversal candlestick patterns under consideration on the chart, it is necessary to wait for a confirming signal and only then make a decision to open a position. For those who hold open positions in the direction of the current trend, the appearance of a ‘hammer’ or ‘hanging’, gives a signal that it is necessary to fix the profit, that a rapid market reversal is quite likely.