
Experienced traders say that for successful trading on the Forex market, it is desirable to know the real volumes of traded currency. Unfortunately, this is simply impossible, as brokers do not have such information.
However, traders have become accustomed to using tick volumes of traded instruments in trading. Although there is a standard volume indicator in the trading terminal, but the indicator determining the tick volume is much more interesting and informative Better Volume 1.4.
Distinctive feature of the indicator
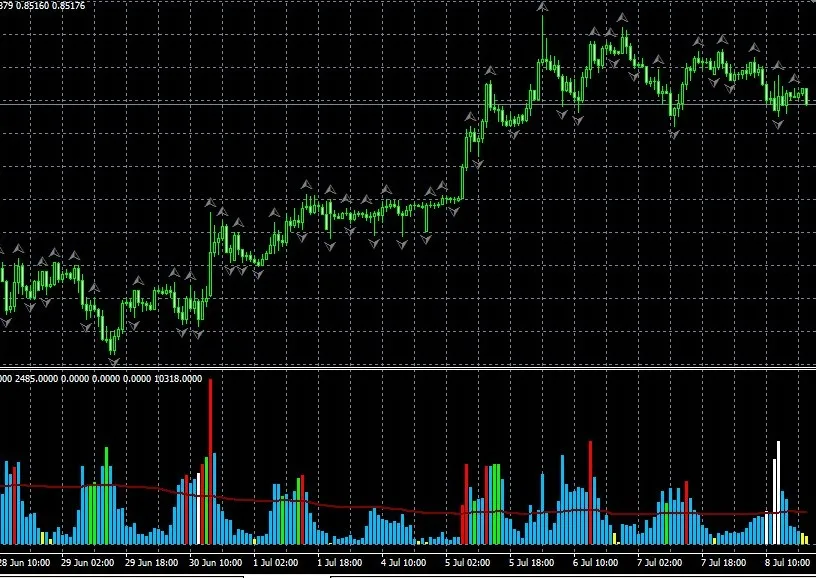
This indicator analyses tick volumes and provides information to the trader in the lower window of the terminal in the form of a coloured histogram. And visually you can see not only the volume, but also the change of trend in the market, with the bar of the histogram coloured in a different colour.
Description of the indicator operation
If the indicator histogram bar is coloured yellow, it indicates a minimum tick volume. This is usually observed at the end of a corrective or trend movement. According to the developers, the appearance of a yellow bar can serve as a confirmation of signals to enter a position or exit the market.
A bar of red colour is inherent in a well-defined bullish price movement or correction in a bearish trend. Usually such colouring of the indicator histogram appears in case of strong bullish candles with a large tick volume. If the histogram bar is coloured white, it is a signal of a bearish trend movement or a correction of a bullish trend. It is exactly the opposite for bars of red colour.
When the histogram bar is green, the indicator gives a signal that the small candle size was a large volume. Usually such a situation occurs before the end of the trend, when large players fix their profits, closing their positions, which is why we get a large volume with a small candle. And even if after experienced traders close their positions, the market continues to move in the direction of the trend, it will not last long, because the trend is already over.
Sometimes there are pink coloured bars, the creators of the indicator advise not to take them into account, they are not informative. There is also a MA (moving average) in the indicator window, but it does not carry any information, just to guide the height of the histogram bars.
Indicator settings
- NumbersOfBars – defines the Number of indicator bars to be displayed on the screen.
- MAPeriod – period of the MA of the indicator.
- LoockBack – number of bars that the indicator analyses. The greater the value of this variable, the less coloured signals of the indicator.