

When conducting candlestick analysis of charts, a lot of signals are based not on a single candle, but on a combination of candles. One of such candlestick combinations is a reversal engulfment pattern. This is, without exaggeration, one of the most important market reversal signals, which is formed from two candles with different body colours.
Where absorption patterns are formed
If the market is dominated by a bearish trend, but suddenly a bullish candle appears, which as if absorbs a smaller bearish candle with its body, this is a signal of a change of trend. This indicates that in the struggle between bears and bulls, the latter have seized the initiative and their pressure is stronger than the bearish one. This is how the bullish absorption pattern was formed. When a bearish takeover pattern is formed, everything happens exactly the opposite.
Main criteria of the model
The absorption pattern must necessarily meet the following criteria:When the pattern occurs, there must be a very well-defined downward or upward trend in the market, even if it is a short-term trend.This pattern is formed by two candlesticks, and the body of the second candlestick must necessarily absorb the body of the first. The body of the second candle must be of the opposite colour.
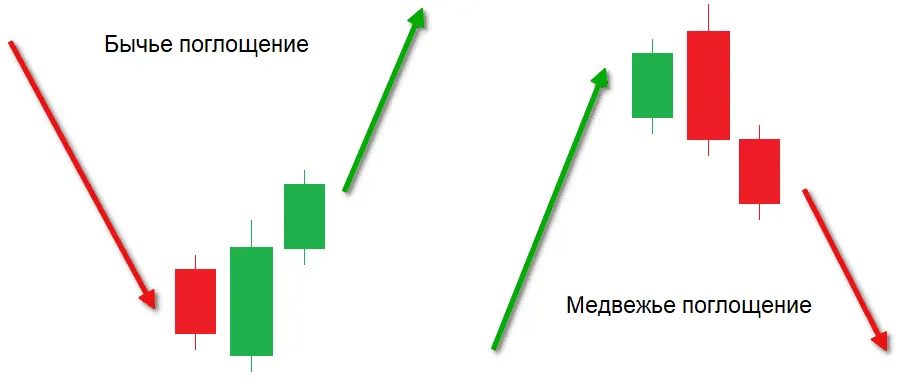
As an exception, we can consider the case when the body of the first candle is very small and this candle can be compared to a ‘doji’. If after a long bearish trend the small body of a bullish candle will be absorbed by a large bullish body, such a combination of candles can serve as a reversal signal at the base. If the situation is mirrored, a reversal signal at the top is formed.
Factors strengthening the probability of reversal, after the formation of the absorption pattern:
- If the body of the first candle of the model is small and the second candle is much larger. This is an indication that the previous prevailing trend has completely weakened and the new trend is gaining strength.
- If a takeover combination is formed after a very long or very rapid trend.
- If you can see a large volume of traded assets on the second candle of the pattern.
- If the body of the second candle of the pattern absorbs several previous candle bodies.
General guidelines
When carrying out candlestick analysis of charts, it should be remembered that candlestick patterns are best worked out on large timeframes. The older the timeframe, the higher the probability of working out reversal candlestick patterns. It is recommended to use candlestick analysis in combination with other types of technical analysis.